
Smart Banners Performance Dashboard:
Designing What Matters

Problem statement
Current Smart Banners lack accessible, banner-specific performance data (impressions, clicks, installs), preventing effective evaluation. Critically, banner interactions are also disconnected from the original web acquisition campaigns that brought users to the site. This means marketers testing different banners can’t reliably determine which one performs better. These significant data gaps impede performance optimization and full-funnel analysis.
Users
Mobile marketing managers responsible for their company's website and apps.
Solution
To close the performance visibility gap, we initially planned a dedicated Smart Banners Performance Dashboard featuring a detailed data table designed to support in-depth analysis of campaign sources with flexible filtering options.
Role
As the team leader, I supported the product designer throughout the project. Given the significant uncertainties around marketers behavior and the high development effort required, I actively promoted deep user research and provided hands-on guidance throughout its execution.
Process
Research
To inform the design of the Smart Banners performance reporting, we conducted user interviews and data studies. The research revealed:
Overview
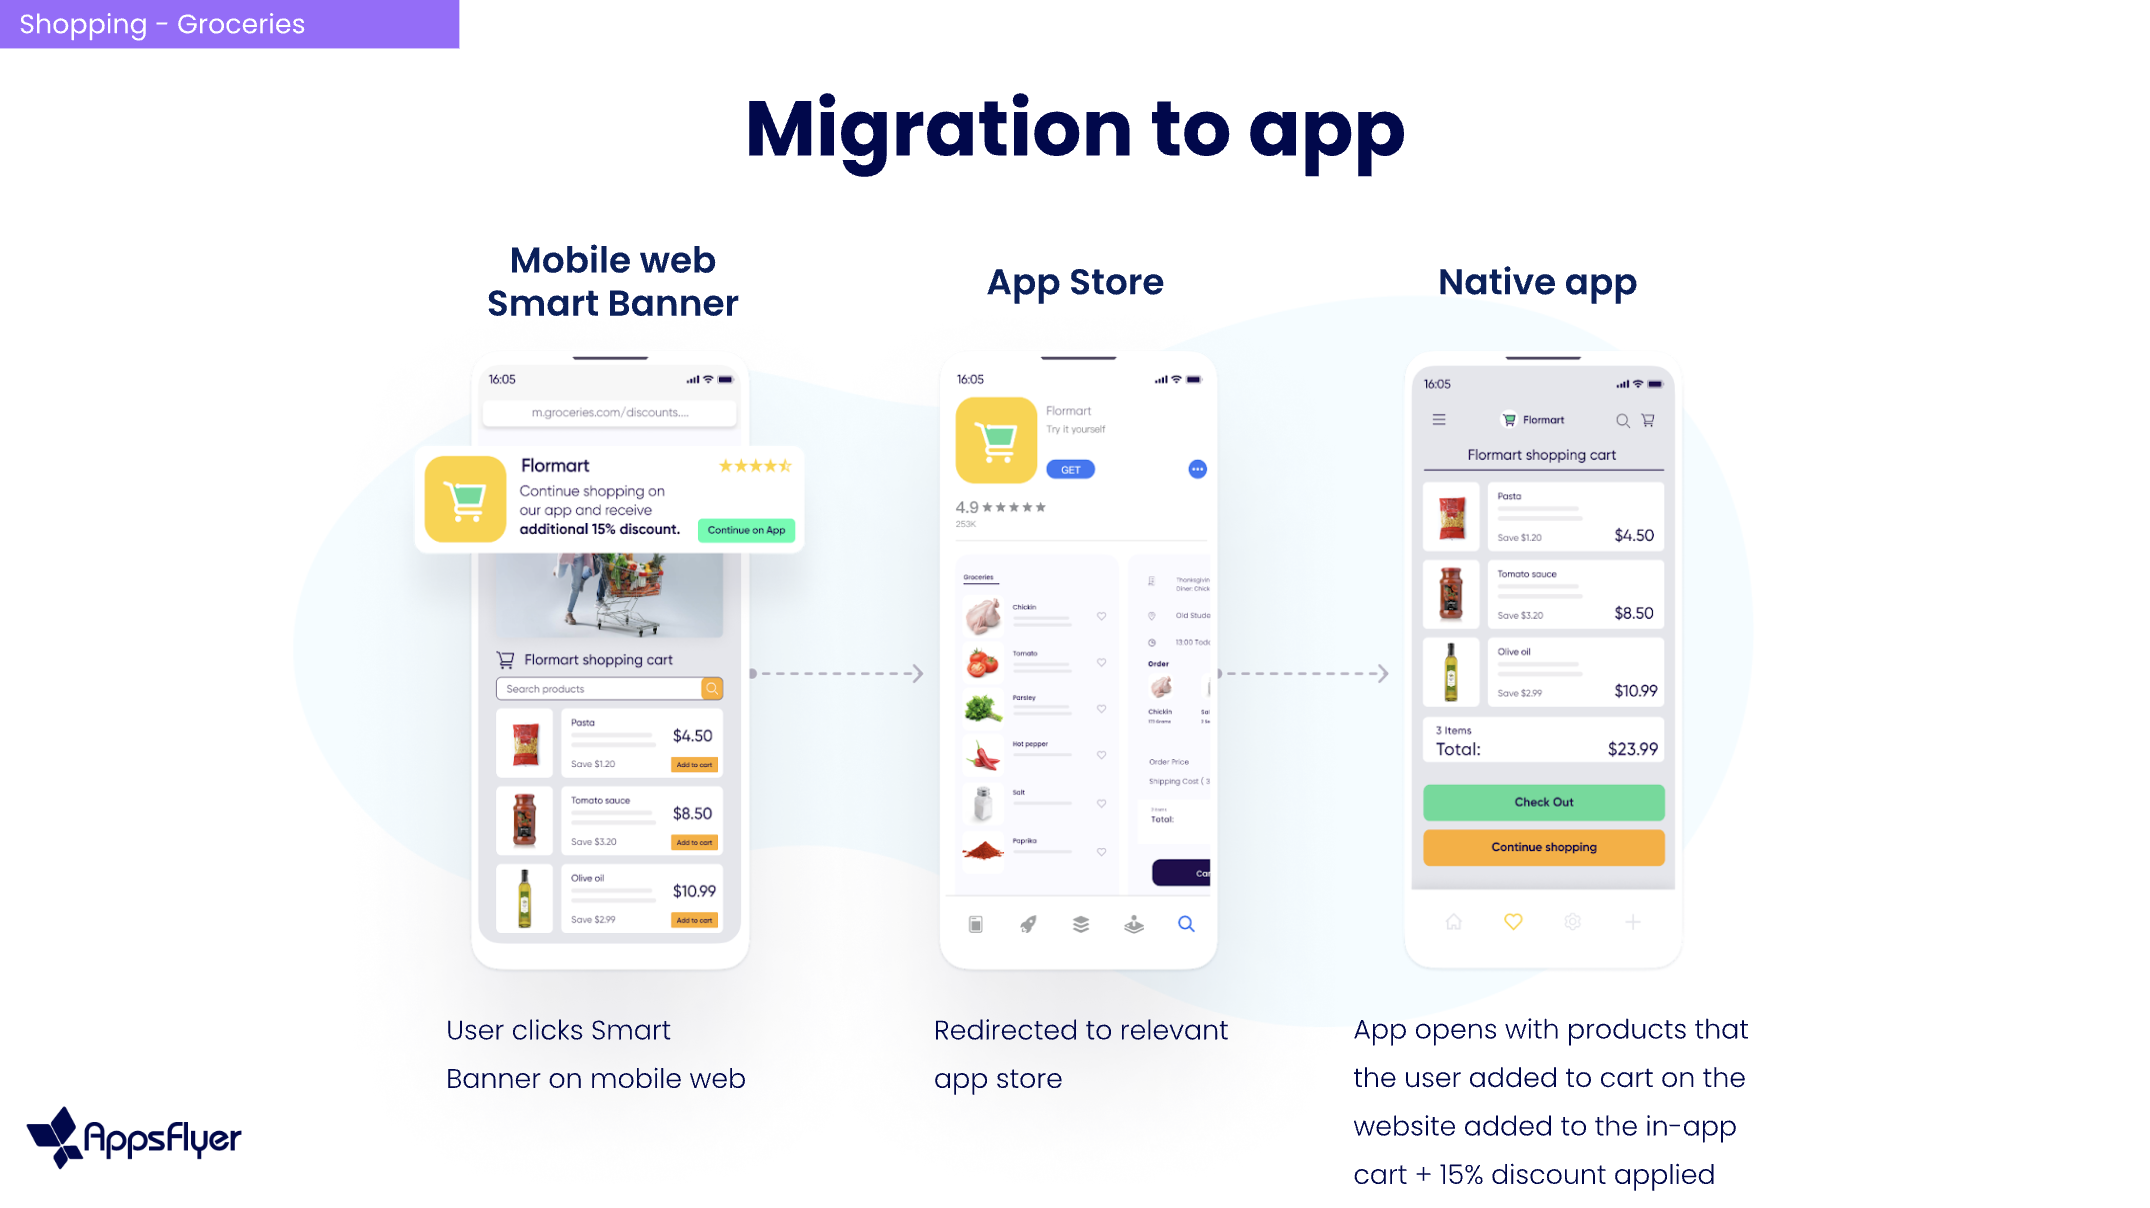
Mobile marketing managers want to convert mobile website visitors into app users and boost engagement. Smart Banners help by displaying personalized prompts that encourage users to either download the app or open specific in-app content, making the transition smooth and effective.
Pivot
Based on these findings demonstrating simpler current needs and workflows, we made a strategic decision to pivot away from our initial plans for a highly complex data table. Instead, we prioritized delivering a more focused solution that directly addressed users' immediate requirements for basic performance visibility, ensuring better adoption and alignment with real usage patterns.

While most users tracked basic metrics like impressions, clicks, and installs, most didn't even have defined KPIs.
Users weren't performing complex comparisons between banners or engaging in deep attribution analysis
There was a significant gap between the Smart Banners feature's potential and its actual usage; users implementation was generally simple

Updated solution
In-context performance card
Phase 1
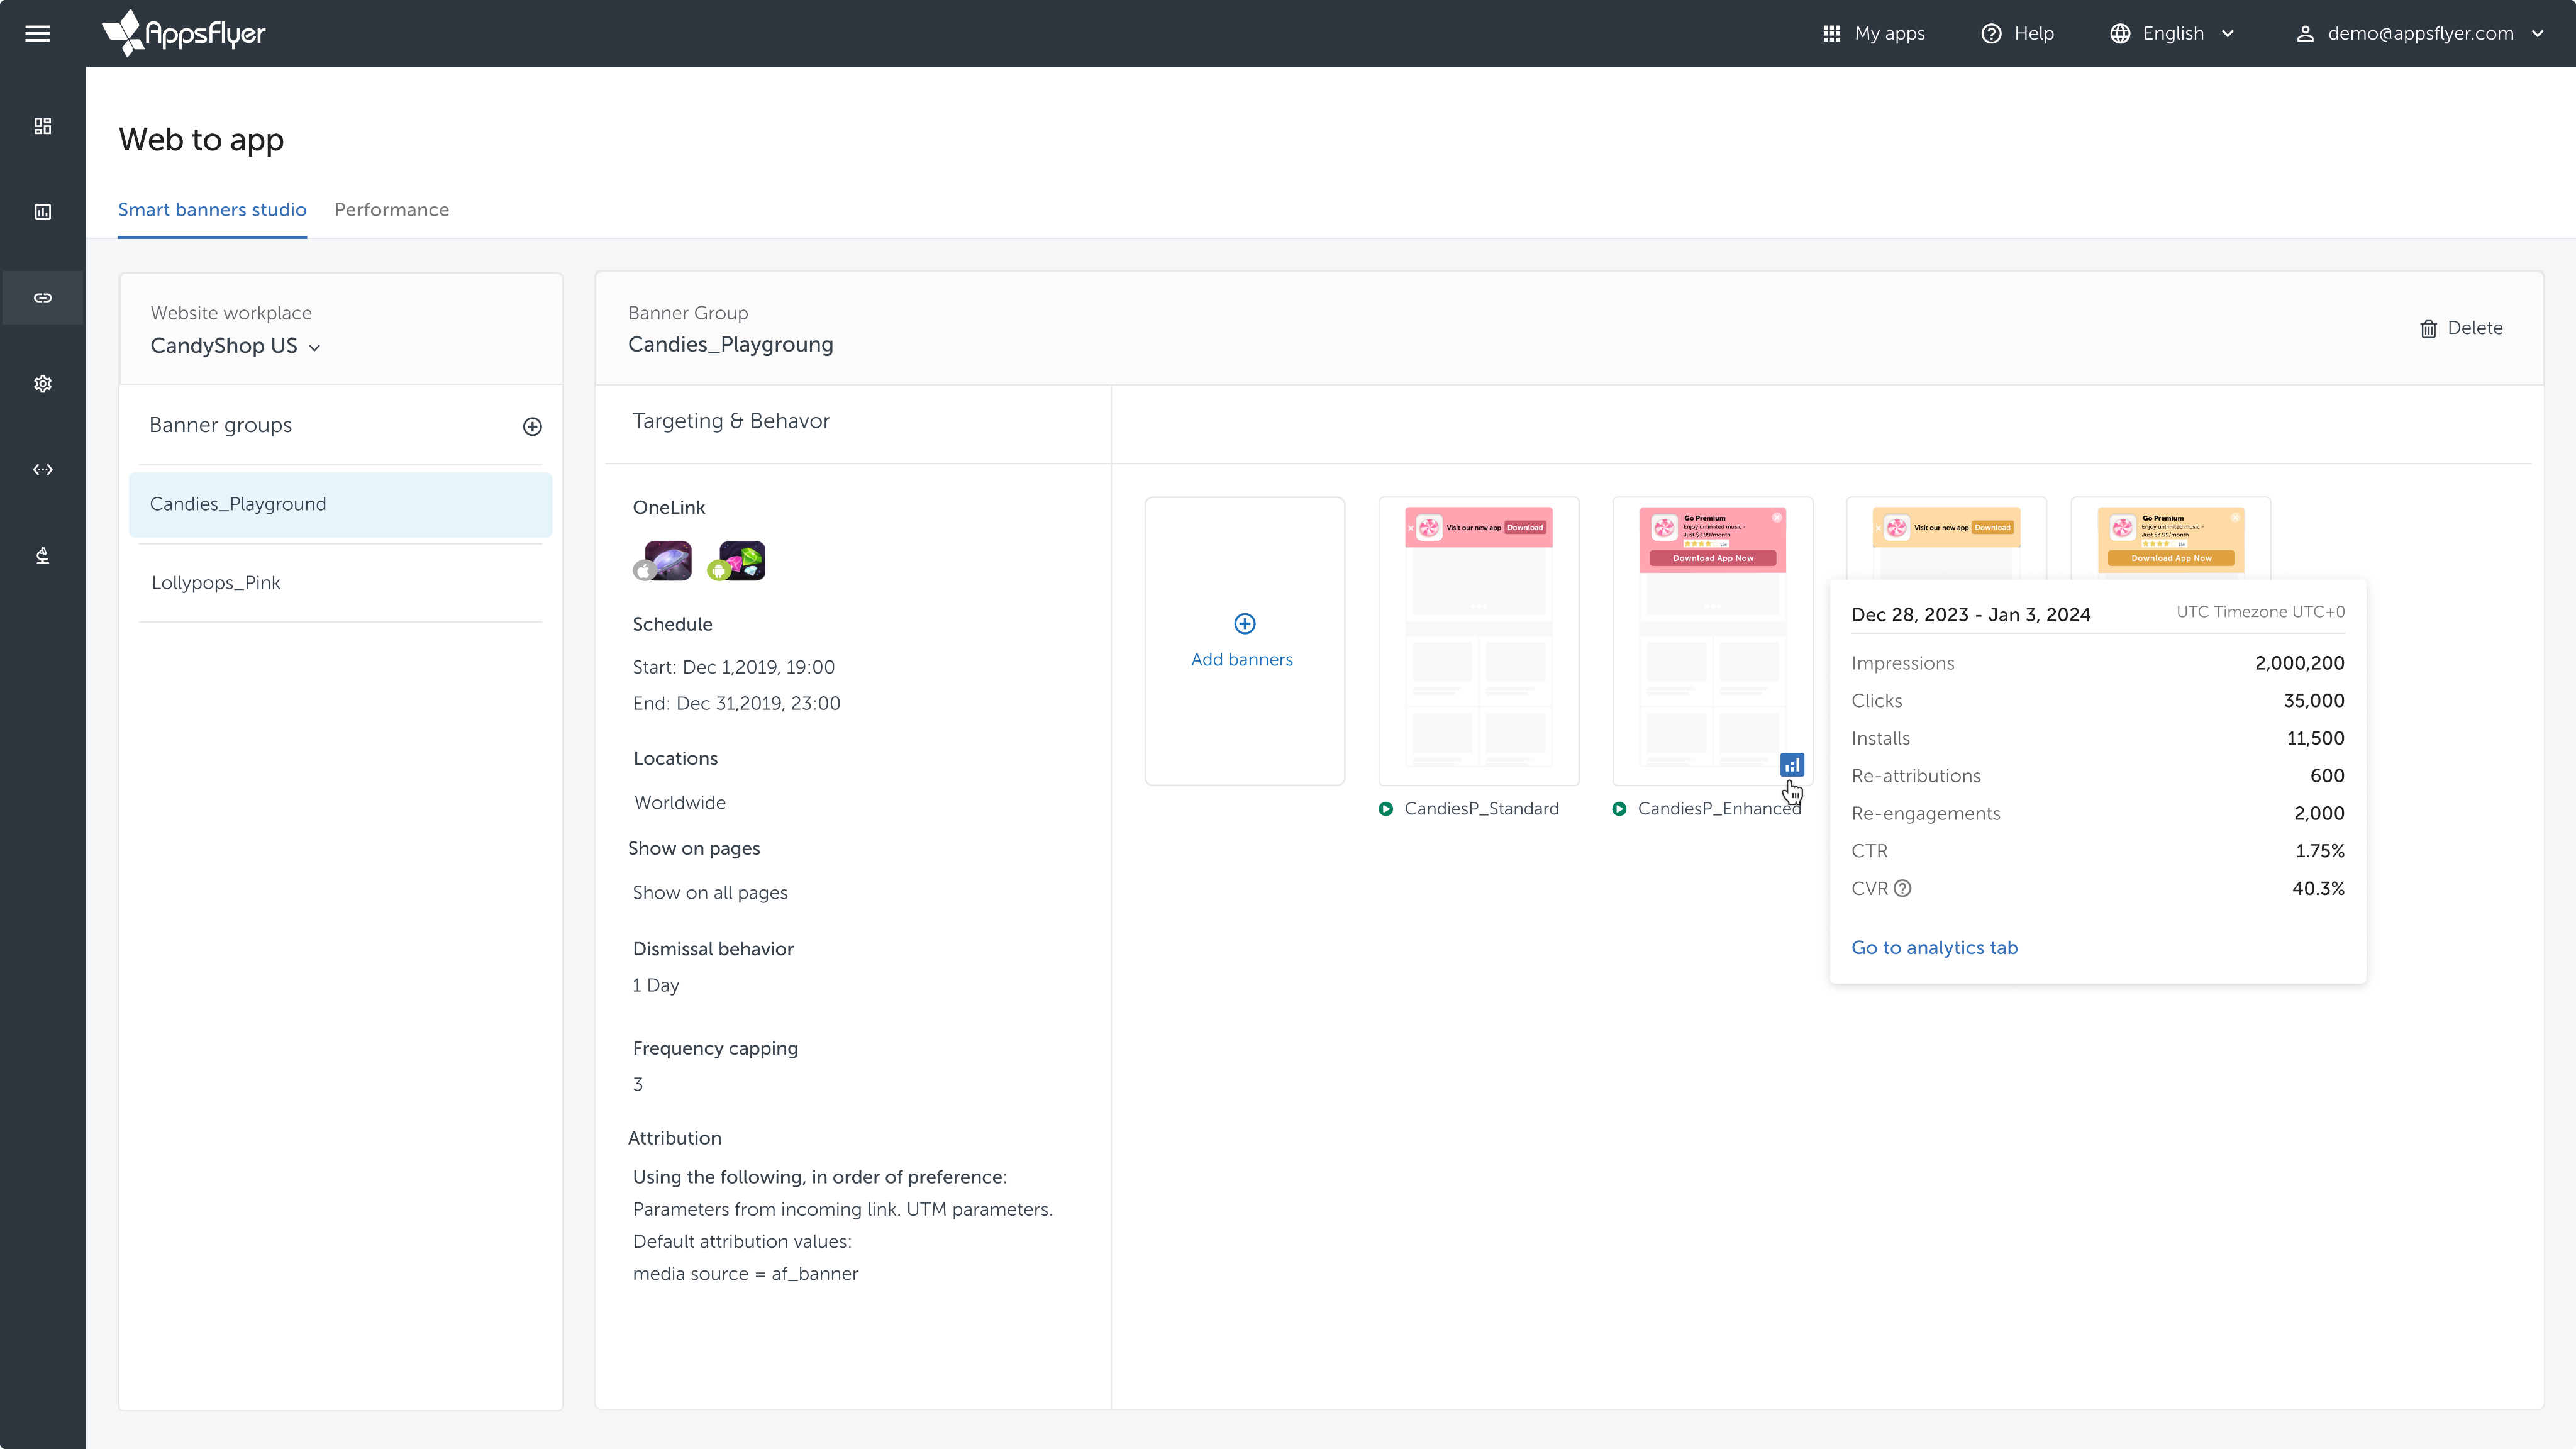
We first integrated Performance Cards directly into the Smart Banner Studio, providing immediate, at-a-glance key metrics for individual banners, addressing marketers’ most basic needs.
Dedicated performance dashboard
Phase 2
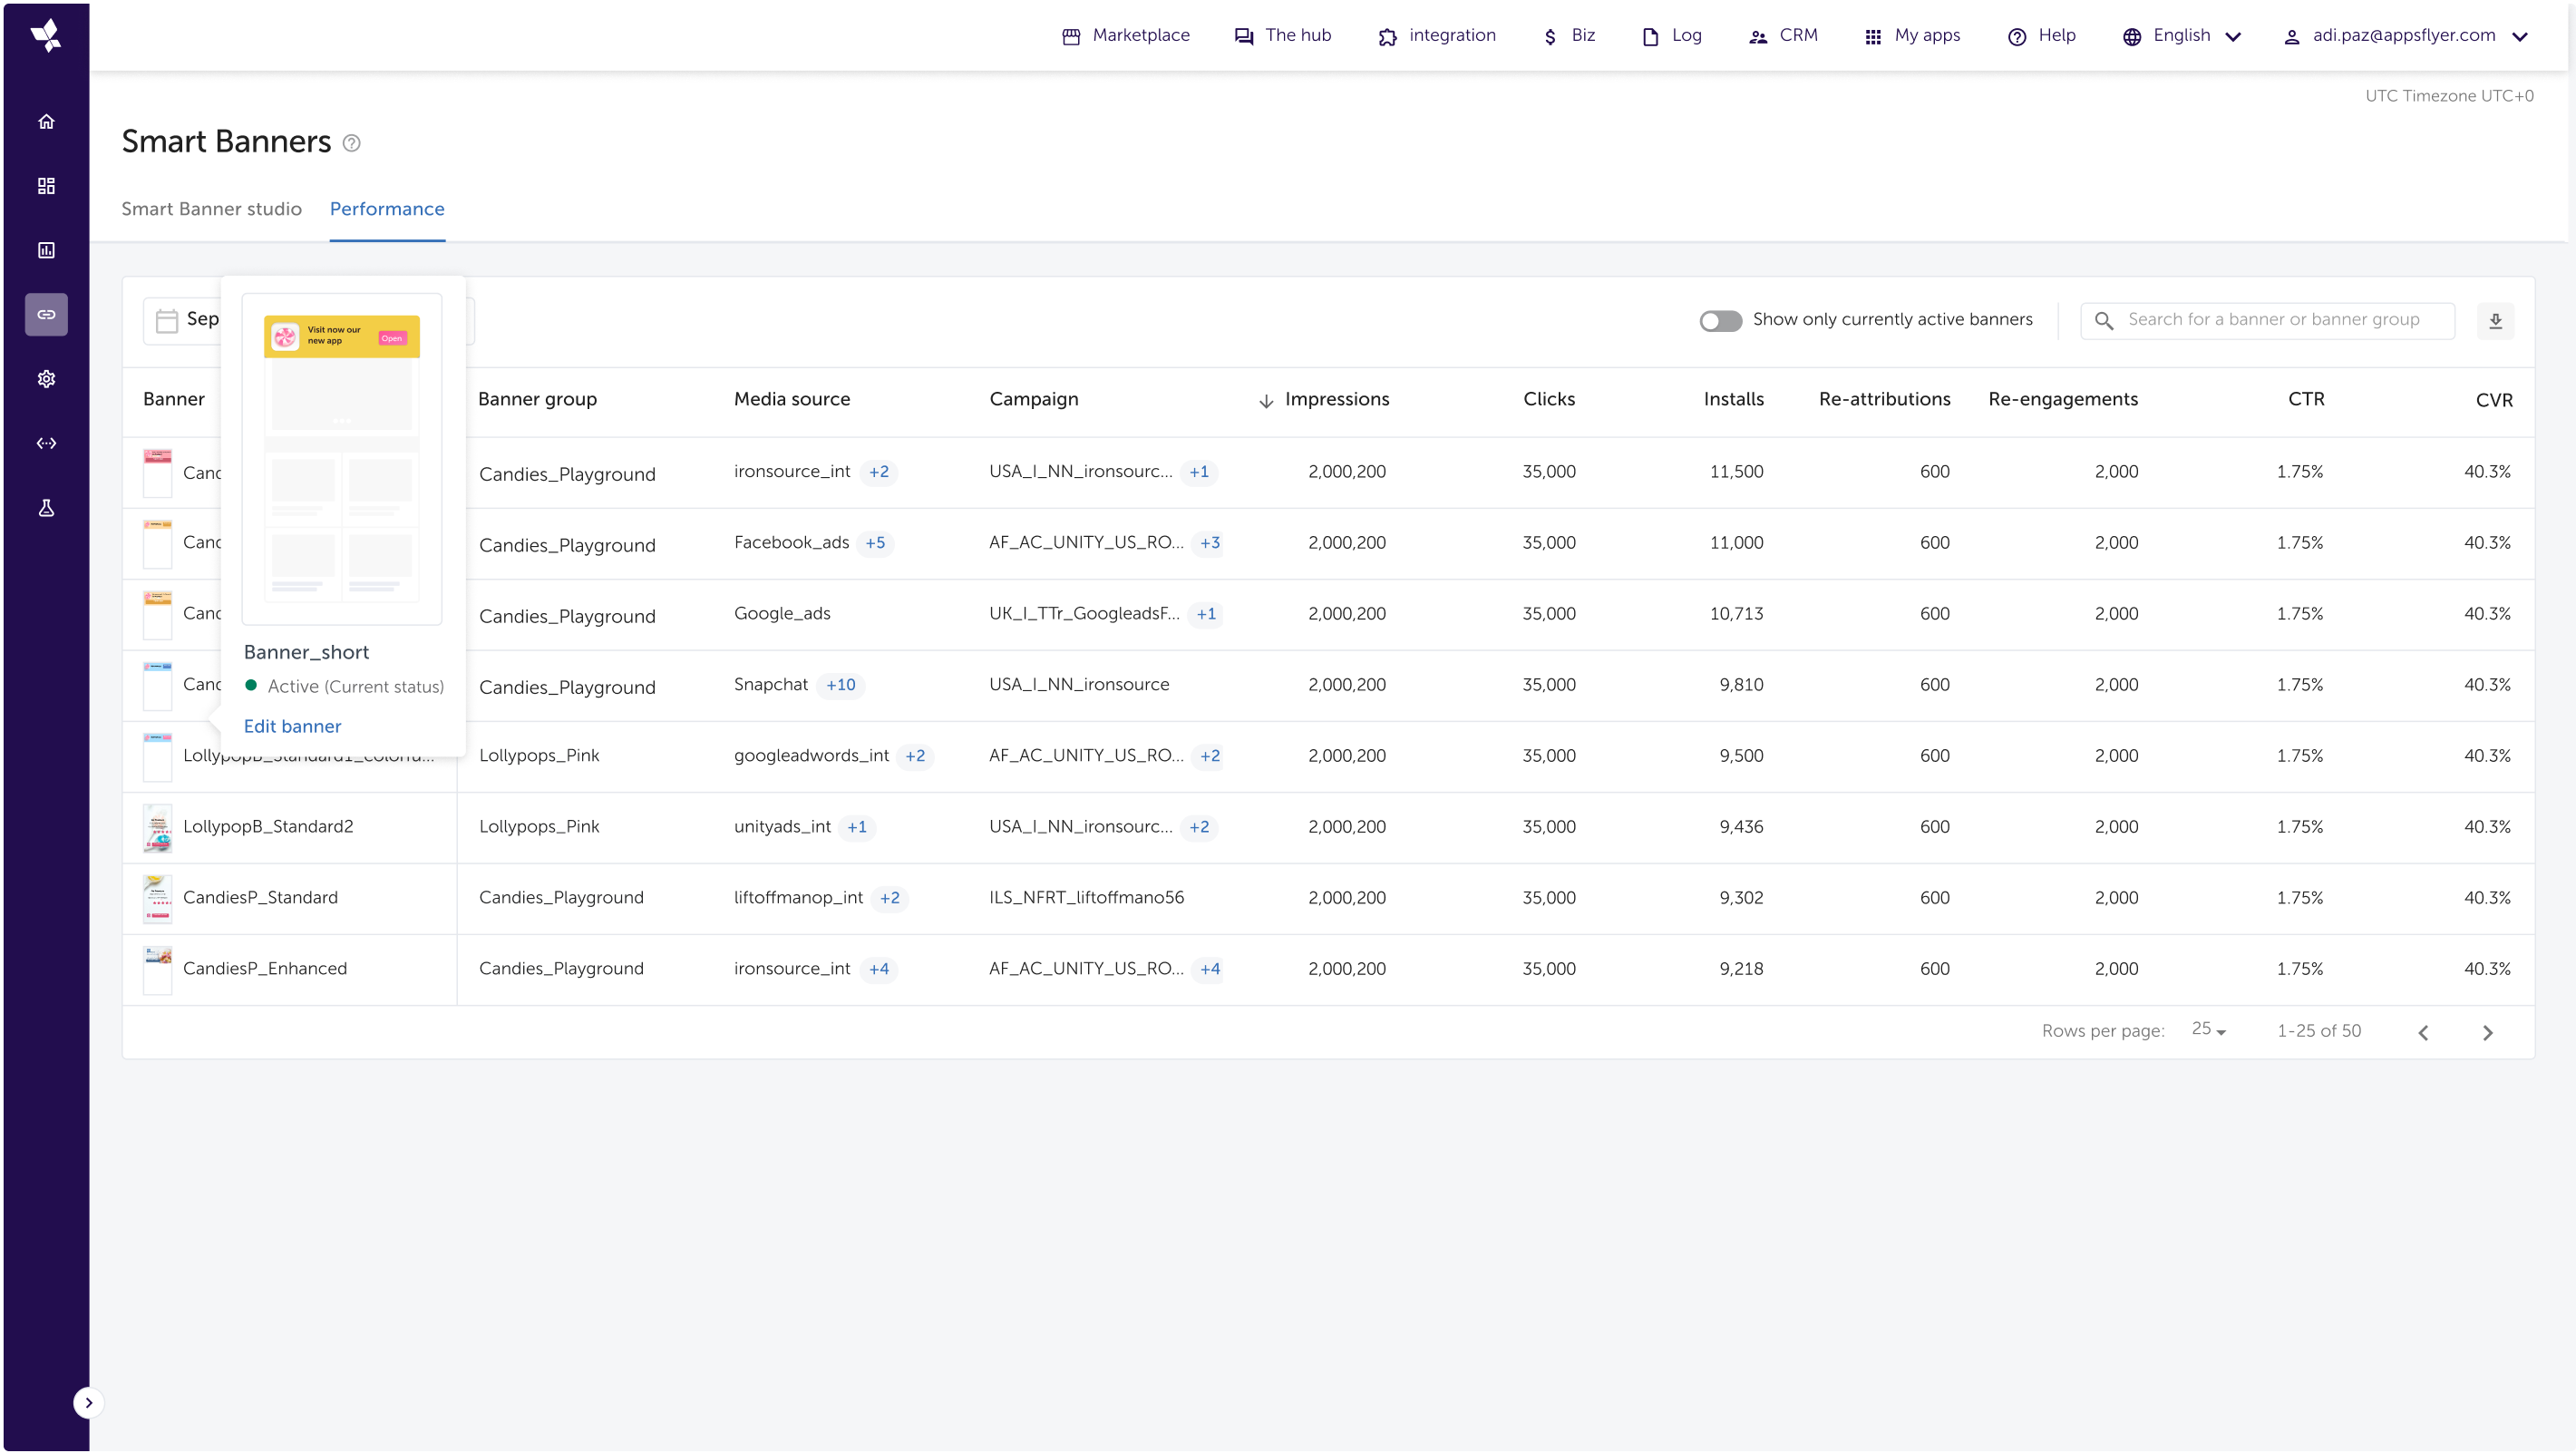
Subsequently, we launched a dedicated Smart Banners Performance Dashboard offering a comprehensive, aggregated view for deeper analysis and comparative reporting across multiple banners over time, yet much simpler than the original design.
Project impact

This research helped us avoid investing significant time and resources into building a solution that users didn’t actually need. It also allowed us to bring a more relevant solution to market much faster.
eynat.pikman@gmail.com
+972-52-5866151


Smart Banners Performance Dashboard:
Designing What Matters

Problem statement
Current Smart Banners lack accessible, banner-specific performance data (impressions, clicks, installs), preventing effective evaluation. Critically, banner interactions are also disconnected from the original web acquisition campaigns that brought users to the site. This means marketers testing different banners can’t reliably determine which one performs better. These significant data gaps impede performance optimization and full-funnel analysis.
Users
Mobile marketing managers responsible for their company's website and apps.
Solution
To close the performance visibility gap, we initially planned a dedicated Smart Banners Performance Dashboard featuring a detailed data table designed to support in-depth analysis of campaign sources with flexible filtering options.
Role
As the team leader, I supported the product designer throughout the project. Given the significant uncertainties around marketers behavior and the high development effort required, I actively promoted deep user research and provided hands-on guidance throughout its execution.
Process
Research
To inform the design of the Smart Banners performance reporting, we conducted user interviews and data studies. The research revealed:
Overview
Mobile marketing managers want to convert mobile website visitors into app users and boost engagement. Smart Banners help by displaying personalized prompts that encourage users to either download the app or open specific in-app content, making the transition smooth and effective.
Pivot
Based on these findings demonstrating simpler current needs and workflows, we made a strategic decision to pivot away from our initial plans for a highly complex data table. Instead, we prioritized delivering a more focused solution that directly addressed users' immediate requirements for basic performance visibility, ensuring better adoption and alignment with real usage patterns.
While most users tracked basic metrics like impressions, clicks, and installs, most didn't even have defined KPIs.
Users weren't performing complex comparisons between banners or engaging in deep attribution analysis
There was a significant gap between the Smart Banners feature's potential and its actual usage; users implementation was generally simple

Updated solution
In-context performance card
Phase 1
We first integrated Performance Cards directly into the Smart Banner Studio, providing immediate, at-a-glance key metrics for individual banners, addressing marketers’ most basic needs.
Dedicated performance dashboard
Phase 2
Subsequently, we launched a dedicated Smart Banners Performance Dashboard offering a comprehensive, aggregated view for deeper analysis and comparative reporting across multiple banners over time, yet much simpler than the original design.
Project impact
This research helped us avoid investing significant time and resources into building a solution that users didn’t actually need. It also allowed us to bring a more relevant solution to market much faster.
eynat.pikman@gmail.com
+972-52-5866151